Good data is important in decision-making but good interpretation of data is essential. Last November, Voicebot released their report What Consumers Want in Voice App Design in collaboration with Voices.com and Pulse Labs. We are fan of Voicebot’s work and this type of analysis is important for the voice ecosystem. However, in our opinion, some of their conclusions could be misleading because of their interpretation of the data.
Why should you care?
If you use research results to inform any of your decisions, you owe it to yourself be able to understand the how and why behind the analyses. This allows you to be critical of your sources of information and make decisions that are better informed. In order to make these decisions, you need to have a bit of statistical knowledge.
Stats 101
Every statistical analysis should essentially ask one question: Are the two groups I am looking at the same?*
*Stats can be much more sophisticated. For this post, we will just look at these two groups and make the assumption that all other factors are the same. In reality though, all other factors are not the same.
For example, I might want to know if one developer makes better-rated skills than the other. Let’s look at Cox Media Group and Stoked Skills LCC, two prolific skill developers with 36 skills each. In this case, we will start with the assumption that both developers have similar average skill ratings. It is my analysis’ job to prove this hypothesis wrong.
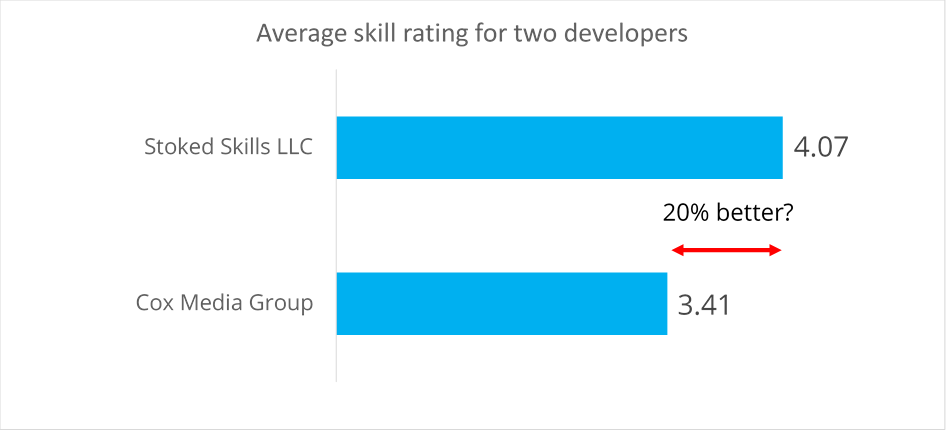
If we only looked at the average rating, we’d see that Cox Media Group’s skills have an average 3.41 stars while Stoked Skills’ skills have an average of 4.07 stars. We might be tempted to say that Stoked Skills is 20% better than Cox Media Group. This would be misleading though. It’s possible Stoked Skills have a few very popular skills that increased the average while their other ones are the same as Cox Media Group’s. It’s impossible to tell yet. Also, what does 20% better even mean?

A better analysis
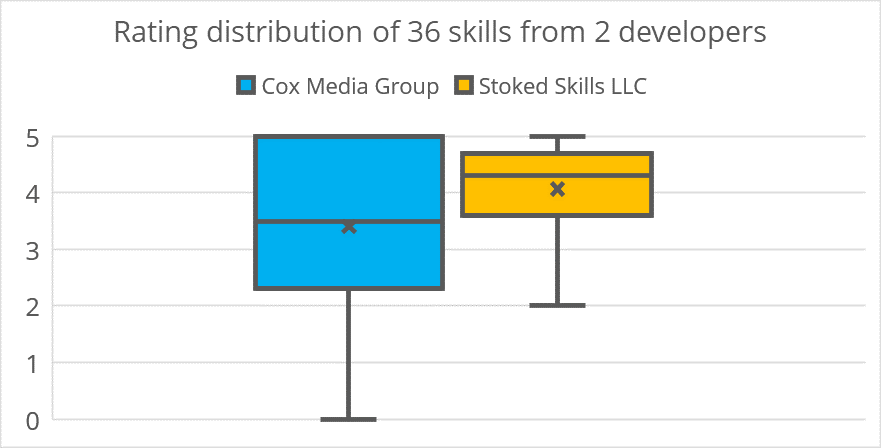
Instead, we want to look at the two developers’ individuals skills. The blue bar represents all of Cox Media Group’ skills while the orange bar is Stoked Skills’. The little X in each bar represents the average rating of that developer’s skills while the line above it represents the median (aka half of the ratings are either above or below this line). The blocks of colour represent the range for 75% of all the skills while the thin lines show the minimum and maximum range of all skills (the worse Cox Media group skills has 0 star while the worse Stoked Skills LLC skill has 2 stars.

Looking at the data this way, we see that while there are differences in these two developers, that difference is not as important as we might have imagined.
Now, we want to run a statistical test to know the likelihood in percentage that these two skill developers are the same (this is our research question, after all). In scientific research, if that percentage is below 5% we say the two groups are significantly different. In other words, if the likelihood that the two developers are the same is less than 5%, it’s safe bet that that’s they are actually different.
In this case, our analysis revealed that the likelihood that Cox Media Group and Stoked Skills LLC are different is only 2%. In other words, if you’re going to make a decision that depends on those two developers being different, you will have made the right choice 98% of the time. That seems like a very safe choice.
Voicebot, Voice.com, and Pulse Labs’ research
Let’s go back to the Voicebot, Voice.com, and Pulse Labs publication. To be clear, this type of research is essential for the voice industry and it’s fantastic that Voicebot regularly put out industry research. We simply believe that the data from these research should be looked at with more statistical rigour in case they inform important decisions.
In their first analysis, they asked 240 people whether they preferred human or synthetic voices. We are assuming that they asked them to rate both voice types on a scale of 1 to 5 (1=dislike, 5=like).Their results found that the human voice had an average score of 3.86 while the synthetic voice had an average of 2.25. From this, they claimed that the human voice had a 71.6% higher rating. This is not wrong, but it is incomplete.
The 71.6% difference between these two averages is meaningless in the same way that the 20% difference between the two voice developers was meaningless. As voice developers, we may want to know whether people prefer human to synthetic voices for our interfaces. If yes, then it would be good to allocate resources to develop interactions with real voice. We unfortunately cannot make that decision based on their analysis. It’s not that their analyses were totally wrong, it’s that there is an important piece missing.
In conclusion
If you made this far, congratulations (and thank you)! We’re huge data nerds who care deeply about the voice ecosystem at Voice Market Data. Reading research reports with data analyses that could lead to bad business decision gets us real fired up. Voicebot, Voice.com, and Pulse Labs’ research provides huge value for the voice community, but it’s equally important that the data are properly analyzed.
If you have any comments or if something was not clear, do not hesitate to reach out! We are also available to run any voice research project you may have.


1 thought on “Getting serious about data analysis for voice decision-making: Notes on the Voicebot, Voices.com, and Pulse Labs’ study”