
Last week, we looked at the distribution of reviews over time. The idea was that reviews could be used to estimate user engagement with Alexa skills. We found that there were spikes of reviewers around the holidays and that Holiday 2017 was the most “engaged” period on record. Because every review is accompanied by a 1-to-5 star rating, I wondered whether there was a difference in the “star rating” in those reviews.
Would people who left reviews over the holidays more positive because they briefly tried a skill, liked it, and left a positive review?
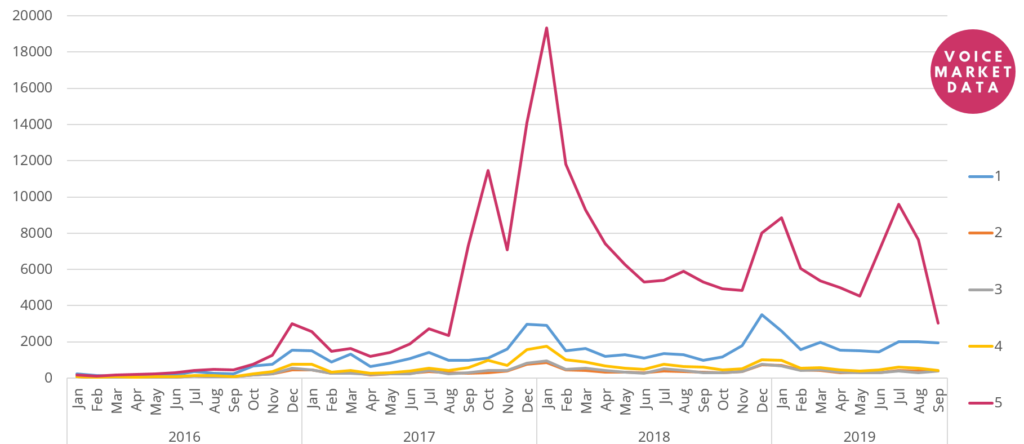
Looking at the data, it looks as though there are spikes of positive reviews over the holidays. However, there are also spikes of the other types of reviews (1, 2, 3, 4). So maybe it’s just that people post more reviews, but not necessarily better reviews. I wanted to take a look at this data from a different angle.

Here we see the percentage of star rating per month. We can see that reviews are typically 1 or 5 stars. The 2, 3, 4 stars ratings aren’t used nearly as much. We can also see that when Alexa launched in 2016, there weren’t as many 5 star rating. It was only in August 2017 that more than 50% of ratings were 5 star. With this data, it’s impossible to tell whether the skills got better, or the expectations changed. It’s very interesting to note that the September 2019 reviews show a sharp rise in 1 star (even in 2, 3, and 4 star). Again, it’s unclear whether this means users changed their expectations, if there was a deluge of mediocre skills, or something else.
As the Alexa market matures, I suspect we’ll see more nuanced ratings. While this will be good for users looking for more honest skills feedback, the earlier skills that got relatively undeserved 5-stars will become more difficult to dethrone for newcomers.
There are several ways to interpret data. I’d love to hear your take on these analyses!


2 thoughts on “Distribution of stars per Amazon Alexa reviews (US, January 2016 to September 2019)”